Welcome to Cisco Nexus Dashboard — The Future of Data Center Management
Transform your data center operations with powerful automation, centralized visibility, and streamlined workflows.
In this hands-on lab, you'll master the tools that enterprises use to manage complex VXLAN EVPN fabrics at scale.
What You'll Accomplish
Deploy Multiple Fabric Types
- Greenfield Fabric — Build a brand-new VXLAN EVPN fabric from scratch
- Brownfield Fabric — Import and manage an existing fabric
- Multi-Site Domain — Connect data centers across locations
- External Connectivity — Integrate with external Layer 3 networks
Master Automation Workflows
- Zero-Touch Discovery — Onboard entire fabrics with a single seed IP
- Template-Driven Config — Deploy best-practice configurations automatically
- Multi-Attach Operations — Configure multiple switches in one workflow
- Intent-Based Networking — Define what you want, ND handles the how
Gain Real-World Skills
- Hands-On Experience — Work with production-grade tools and workflows
- Best Practices — Learn Cisco-recommended fabric configurations
- Troubleshooting — Verify configurations and validate connectivity
- Career Advancement — Build skills that enterprises demand today
Why This Matters
- Reduce Manual Effort — Hours of CLI work become minutes of GUI clicks
- Eliminate Configuration Drift — Templates ensure consistency across devices
- Centralized Management — One dashboard for all fabric operations
- Faster Deployment — Go from planning to production in record time
By the end of this lab, you'll understand how modern data centers leverage automation to deploy,
manage, and scale VXLAN EVPN fabrics — transforming network operations from manual, error-prone processes
into streamlined, repeatable workflows.
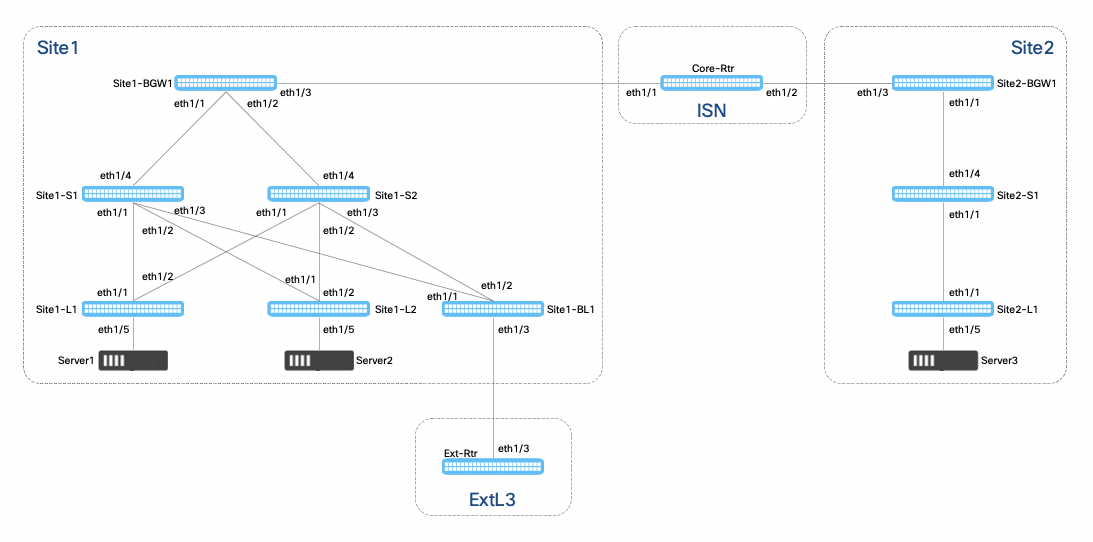
Lab Topology — Powered by Cisco Modeling Lab (CML)
This lab environment is built entirely in Cisco Modeling Lab (CML), a powerful network simulation platform
that provides a realistic, production-like environment for learning and testing. The topology below shows the complete
multi-site VXLAN EVPN fabric you'll be working with throughout this lab.
Download the CML Topology
Want to recreate this lab in your own CML environment? Download the complete topology file below.
This YAML file contains all device configurations, connections, and settings needed to build an identical
lab environment.
Download LTRDCN-2654.yaml
Pro Tip:
At the top of each section, you'll see a progression bar showing where you are in the lab.
This helps you track your progress as you work through the exercises.