Transform your fabric from planning to production by pushing Day0 provisioning to all switches with a single action
You've already set up the initial plan for your Site1 Greenfield VXLAN EVPN fabric. You have also added your switches, assigned their roles, and created a vPC domain between two leaf switches. These steps prepared your network for the next phase, called Day0 provisioning.
Instead of doing everything at once, this section focuses on deploying your configuration plan (configuration intent). Doing this will update your switches from "Out-of-Sync" to "In-Sync".
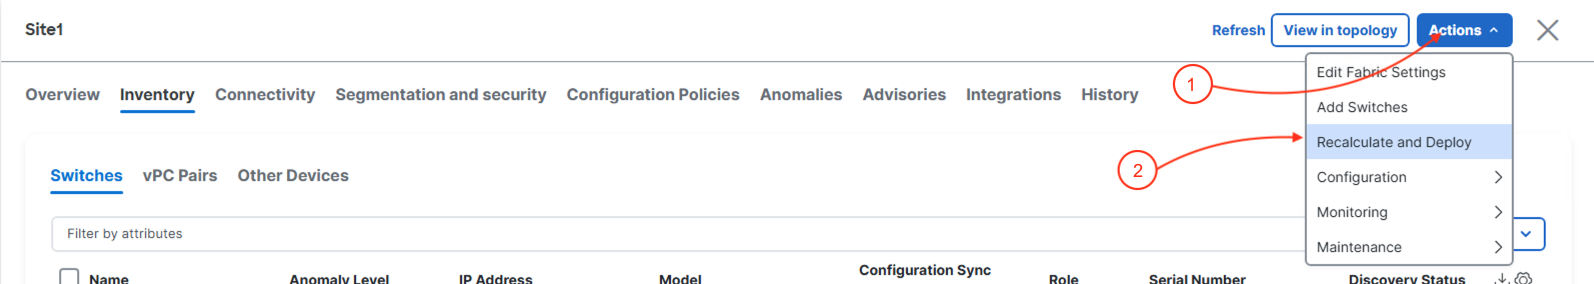
To start, use the "Recalculate and Deploy" action at the fabric level:
At the top right of the Site1 fabric, locate the fabric-level Actions button:
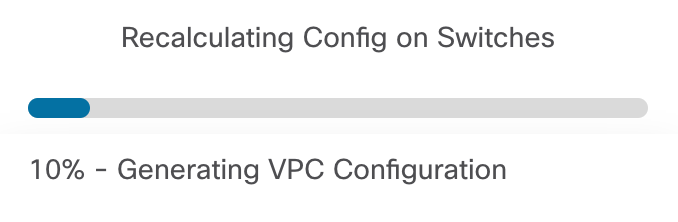
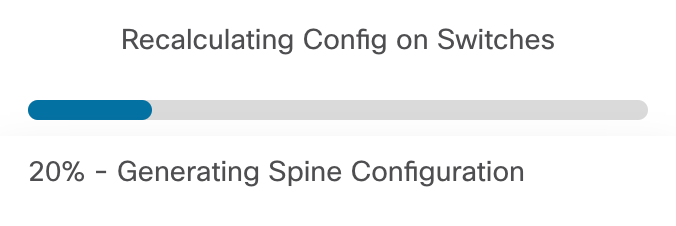
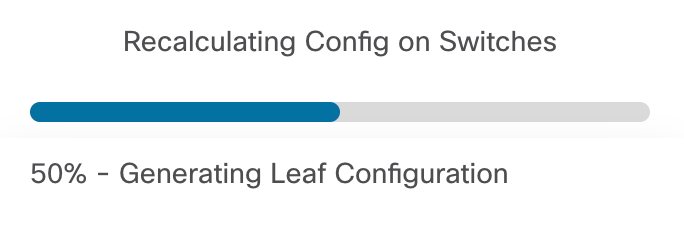
After clicking Recaculate and Deploy, Nexus Dashboard will generate the configuration based on intended configuration best practices per role from templates and your user input when you created the fabric initially. The screenshots below give you some examples of the displays NDFC provides you to know where the operation is at in the process for recalculating:
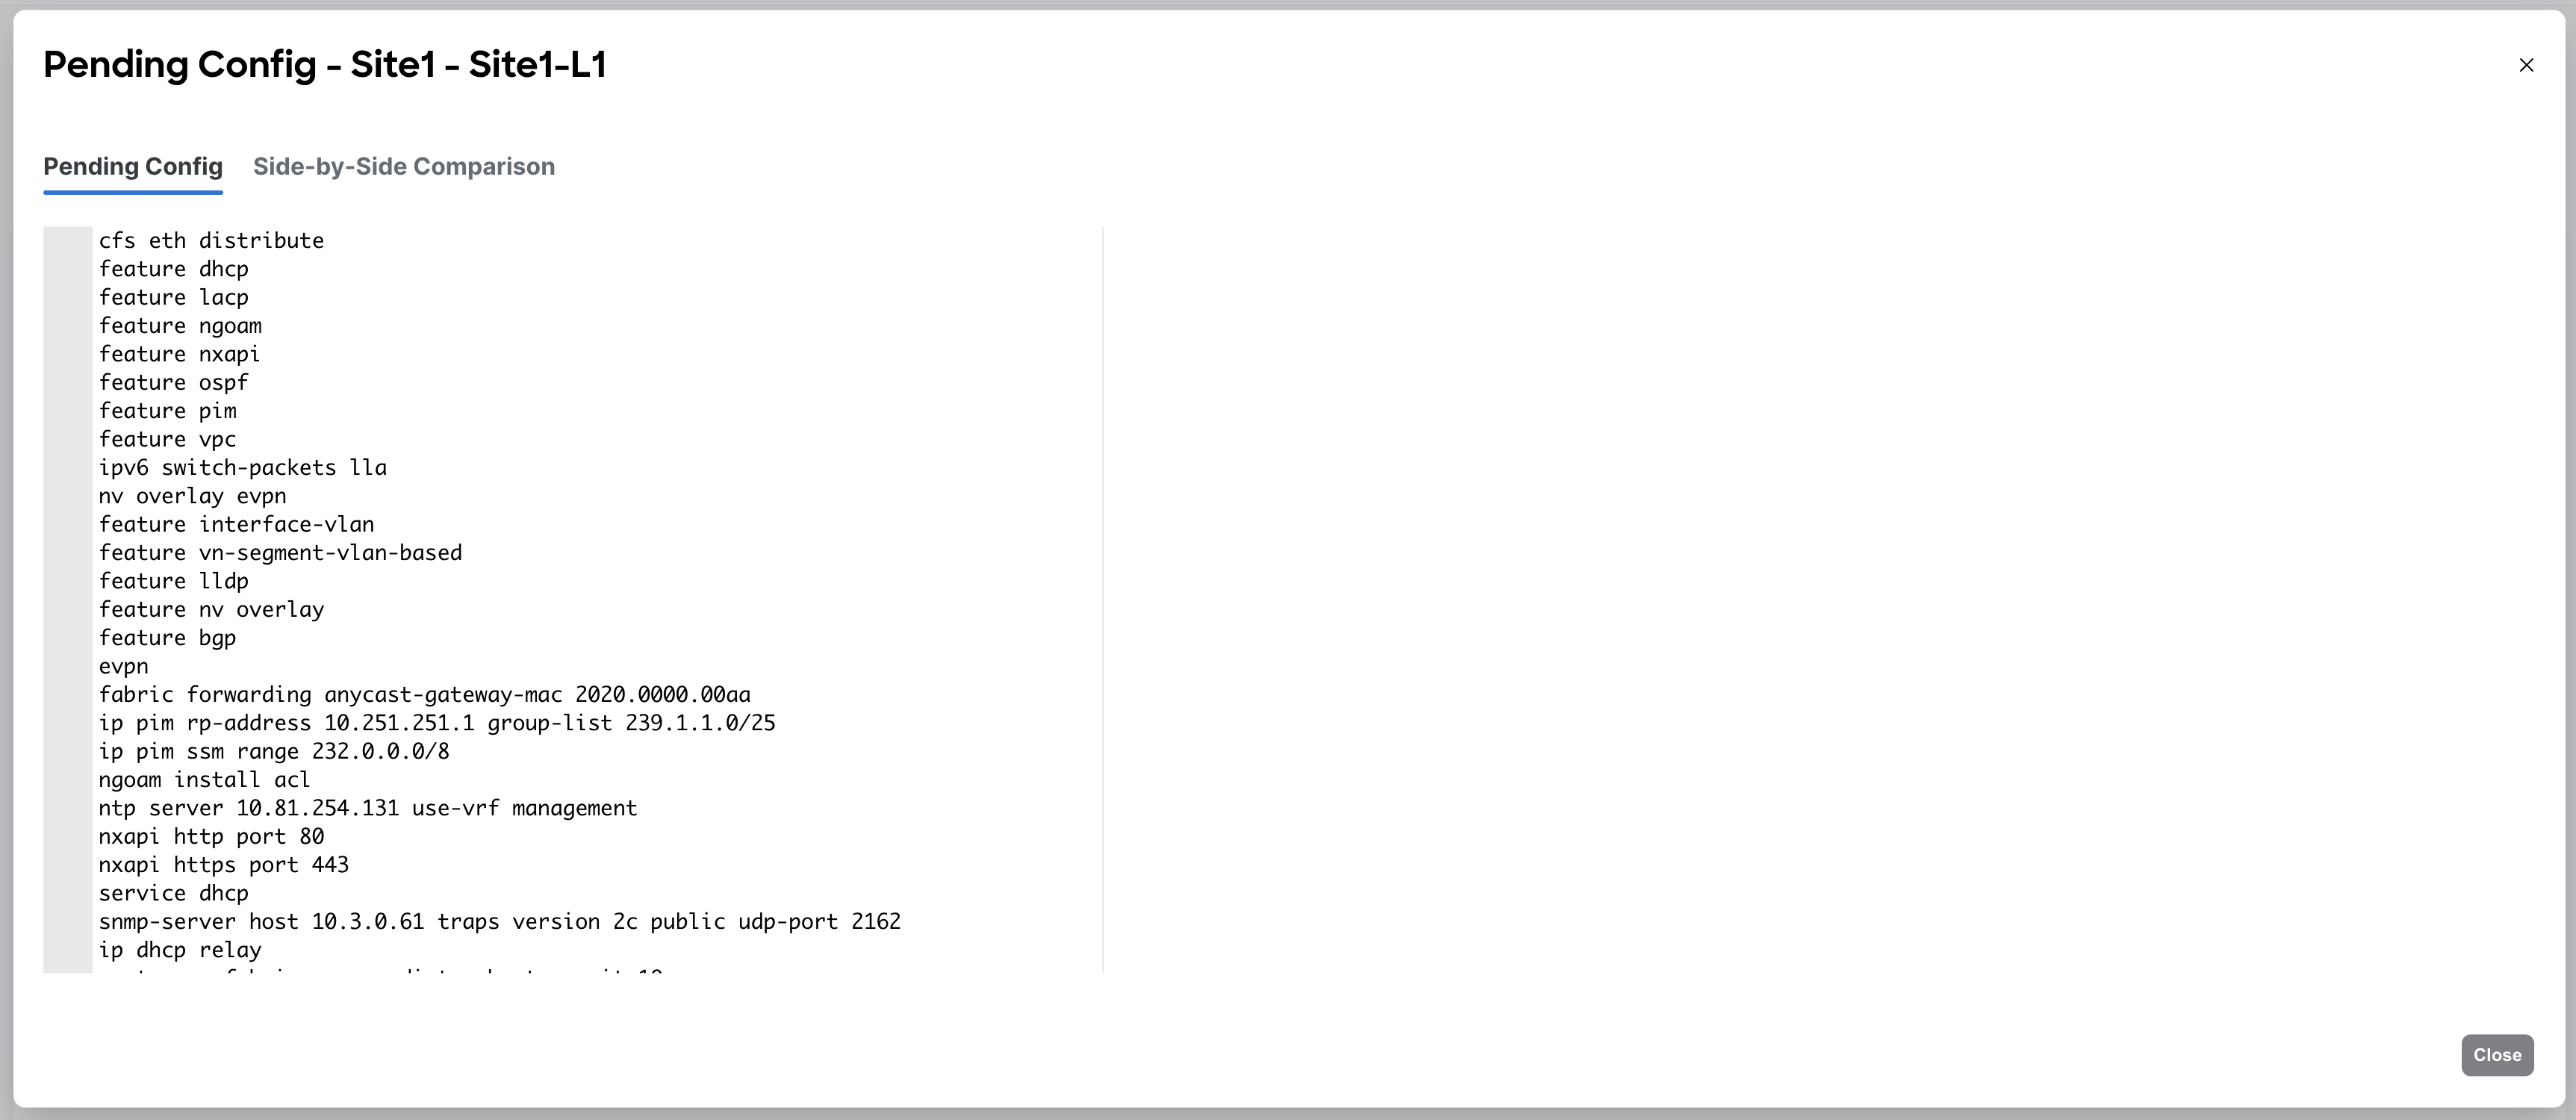
Once the intended configuration has been generated, Nexus Dashboard provides the option for you to review the configuration in the Deploy Configuration first stage called Config Preview. As an example, locate Site1-L1:
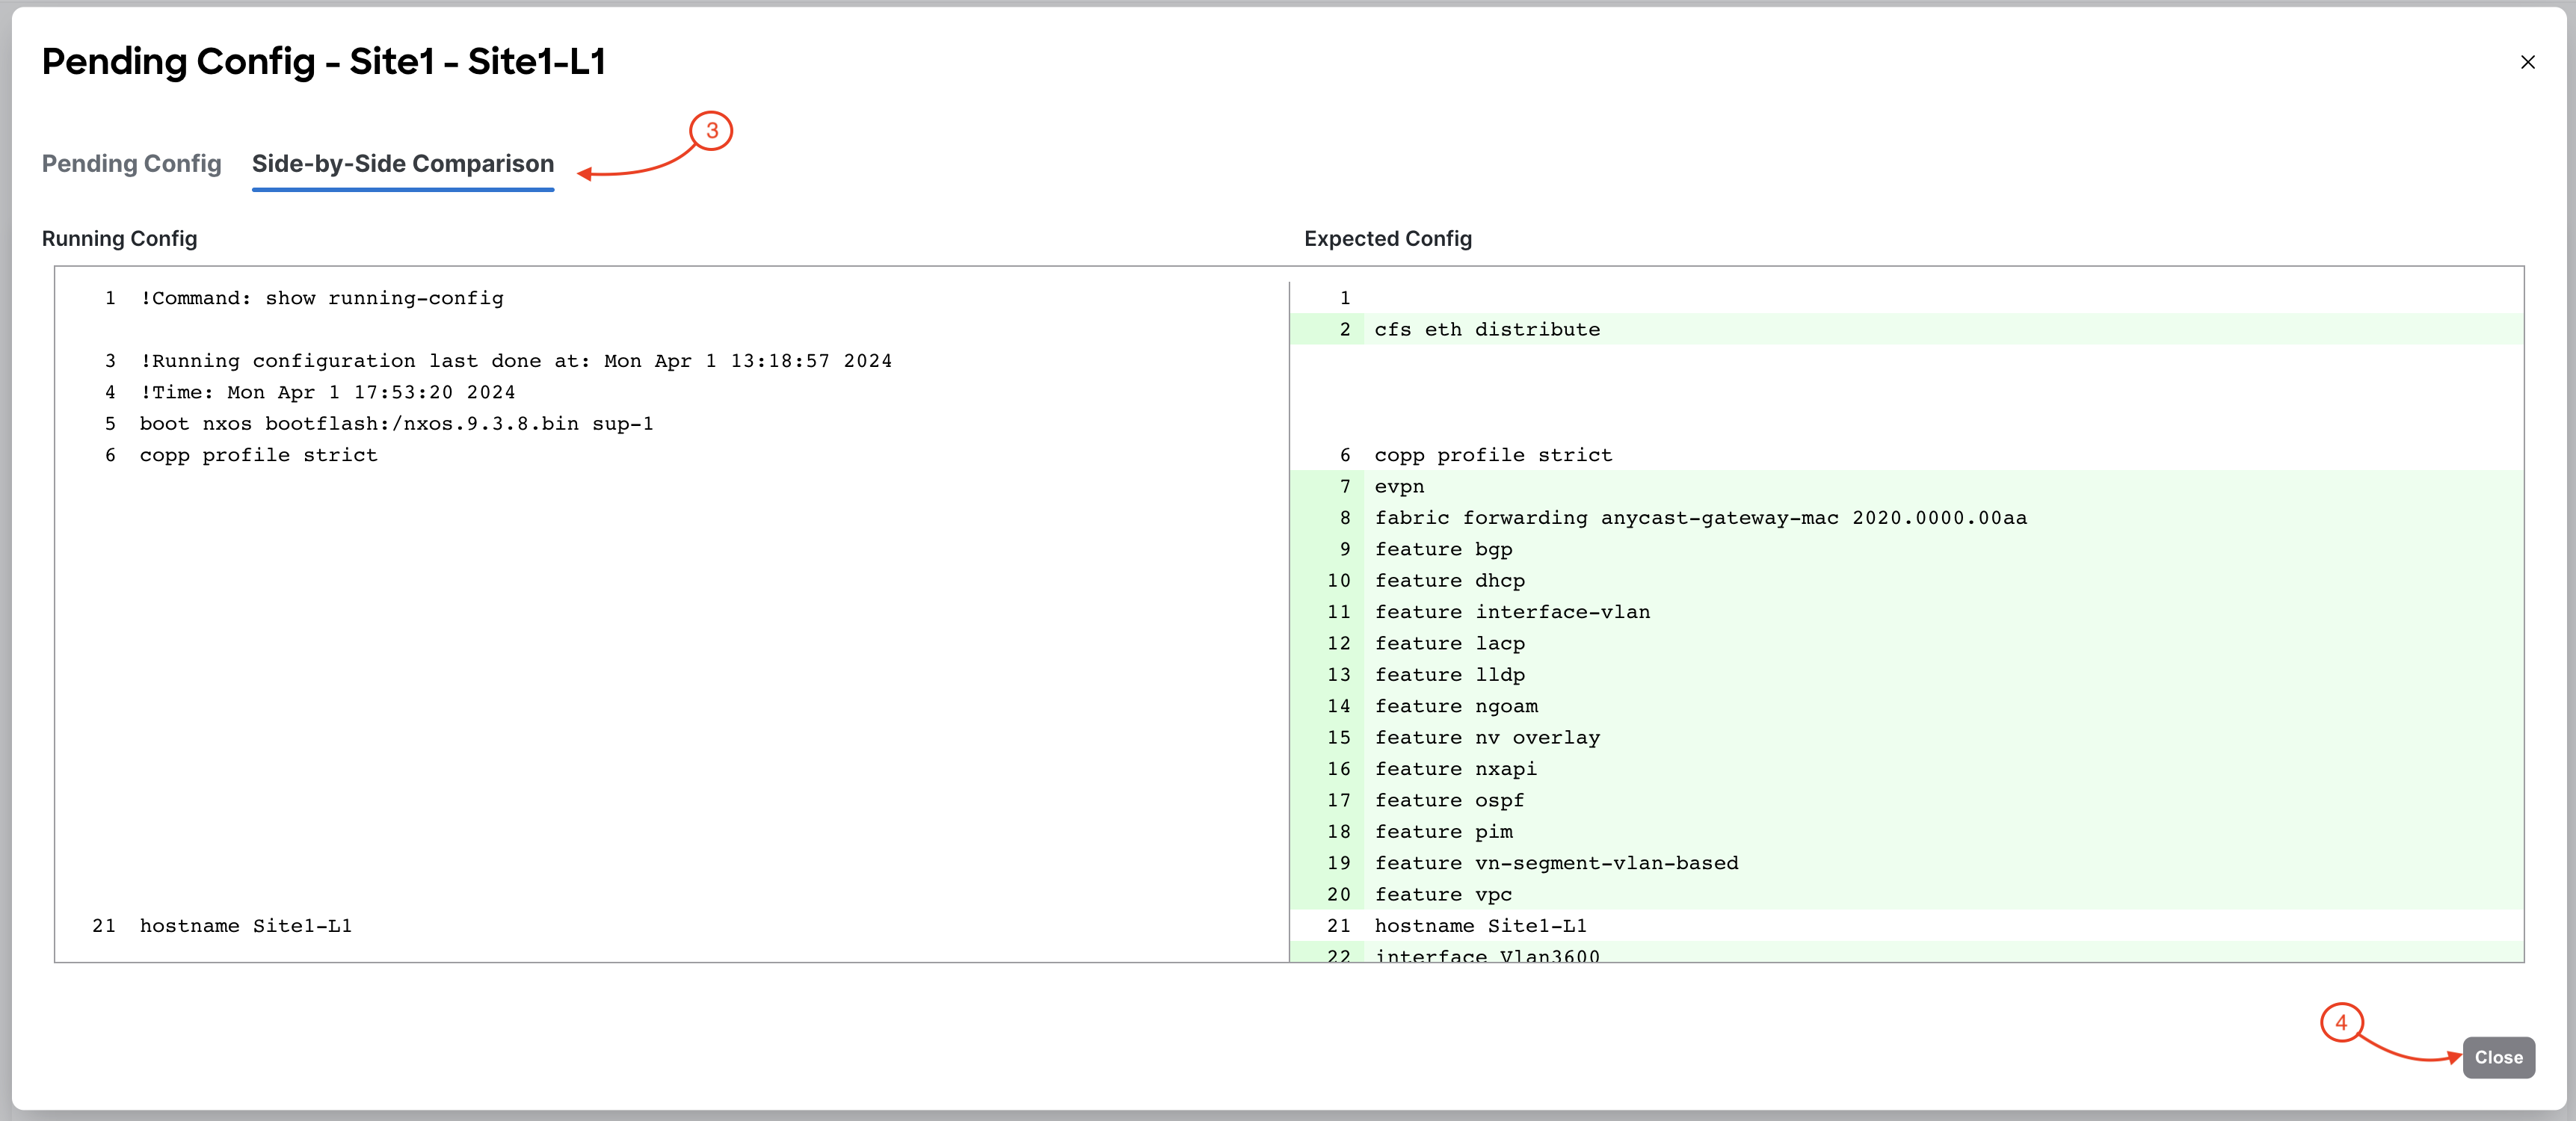
Upon closing Pending Config, you will be back in the Deploy Configuration wizard and you can proceed with deployment:
The stage moves to the second stage called Deploy Progress where the Out-of-Sync status will change to STARTED while Nexus Dashboard deploys each switch's role specific configuration. Make note that you can see the progress bar for the executed number of lines being configured:
Upon a successful deployment, Nexus Dashboard Deploy Configuration wizard should look as shown in the screenshot below; all green with SUCCESS messages and each switch's expected configuration progress bar also displaying as green and fully executed. If any error occurred, Nexus Dashboard will display a notification and the status reverted back to Out-of-Sync.
Back at the main Switches overview, each switch in your Site1 fabric should display a Config Status of In-Sync. Additionally, the VPC Role and VPC Peer columns should be popoulated with role and peer statuses between Site1-L1 and Site1-L2. If these columns are not populated yet, give it a brief moment while NDFC syncronizes. This deployment action provisioned the entire underlay for you. You will verify the configuration deployed to your fabric a little later in the lab after configuration deployment of your first overlay.
Revisist the main Overview dashboard and now examine what the dashboard is populated with after initial deployment.
Notice the Config-sync status In sync and Deployment status is Enabled.